
By Kevin Miller
Just over a year ago, I was approached by Samsung with the idea of a UHD Blu-ray test disc, and was asked to draft an outline. The company then commissioned Florian Friedrich, CEO of AV-TOP in Munich, Germany to produce the disc. The Reference UHD HDR test disc is the first effective tool for evaluating and optimizing HDR displays.
In late June of this year, we introduced the Reference UHD HDR test disc at the CE Week show in New York City, and conducted demonstrations on its design, intent, and usage. The disc has now been distributed to key members of the industry’s technical press, and prominent ISF Calibrators around the country.
Friedrich, who is a pioneer in the area of understanding and utilizing HDR video, determined early in his experimentations that SDR test material did not work to effectively evaluate the performance of HDR displays. The main reasons are the vastly different levels (black, white), and the new EOTF PQ or SMPTE 2084 gamma curve in HDR versus SDR. Another factor is that we now have on the market displays from Samsung, Sony and others that are capable of well over 1000 Nits (cdm2) of peak light output, which is considerably brighter than any consumer displays we’ve ever had for SDR playback. Add to that the fact that HDR10 content can be mastered with a peak luminance reference of 1000 or 4000 Nits depending on what the studio wants to do, it further complicates things in terms of evaluation and optimization.
These are some of the aspects of HDR that required the design of HDR specific test patterns. The best example of the differences between SDR and HDR patterns is the PLUGE or Black level test pattern. In a traditional SDR PLUGE pattern with a logarithmic grayscale in the middle of the frame that has 4 blocks stacked on top of one another in ascending order of brightness, the top block represents 100% peak white, the block below it is 75%, below that 50%, and the bottom block is 25%. This pattern design would not work as an HDR PLUGE pattern, because the APL (Average Picture Level) of the pattern would be much too high. The top block at 1000+ Nits of brightness would make adjusting the black level impossible as it would blind you to the darker more subtle aspects of the pattern that you need to see clearly to make the adjustment accurately.
The HDR version of the PLUGE that Friedrich designed has the top box in the logarithmic grayscale at 100 Nits or about 10% of the peak luminance of the display and what the disc was mastered at. The block bellow is 50 Nits, the one below that is 25 Nits, and the bottom block is 12.5 Nits. One of the reasons for creating the pattern at these levels is that the vast majority of HDR content has an APL (Average Picture Level) of about 100 Nits. There are only very short bursts of high light output in most HDR content where there are speculative highlights like a bright sun setting with a dark background.
Friedrich’s other major finding was that static patterns for measuring grayscale and color in SDR yield inaccurate results. He observed that measurements varied greatly on a number of flat panel displays because the luminance of the display begins to drop just seconds after beginning measurements. This results in wildly varying readings from the same test pattern, which is particularly prominent with high luminance white and color windows, and white and color fields. To correct the issue, Friedrich created dynamic or moving patterns for measuring and calibrating grayscale and color gamut that keep the display relatively stable in luminance, which provides more stable and trustworthy measurements.
These are some of the issues that make evaluation and calibration of HDR displays quite a bit different from how we have traditionally calibrated displays for SDR playback.
Many other test patterns are available for evaluating and optimizing HDR performance. The aforementioned PLUGE pattern, a white level pattern for determining the appropriate clipping level depending on what luminance reference the content was mastered at, high frequency luma and chroma patterns for checking sharpness and edge enhancement circuits, and an ‘’all-in-one pattern’’ that shows all aspects of performance at a glance, make up the Basic Test material.
Additionally, the test disc includes color patterns at different percentage levels for measuring color gamut, 50% and 100% windows for calibrating the grayscale, 100% luminance windows at 10%, 25%, 50%, and 100% sizes for measuring the peak light output of the display, and two black level patterns for measuring the MML (Minimum Luminance Level) of the display to name just a few patterns in the Advanced Test Material.
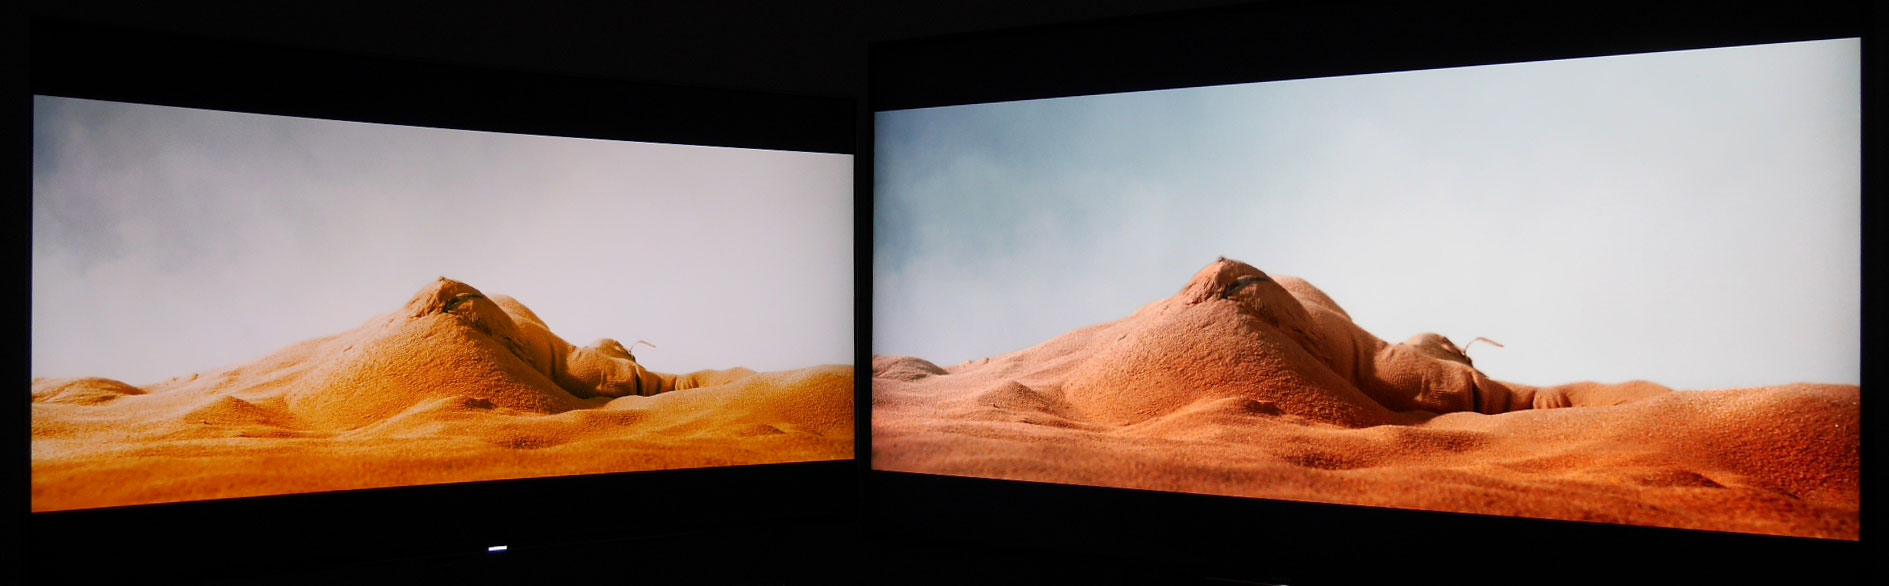
Friedrich shot and color graded video clips for evaluation of different kinds of HDR content, including Dynamic Range, Natural Colors, Display Load Dependency, Wide Color Gamut, and 10-Bit versus 8-Bit video performance. Available as well is a Custom Workflow in CalMAN that takes the calibrator and/or technical reviewer through the entire evaluation and optimization process with the test material on the disc, and prompts in the Workflow on where to navigate to on the disc to get to the different test patterns needed. The package also contains an excellent manual that walks the user through the entire disc.
http://isftv.com/wp-content/uploads/2016/09/samsung_disc_inlay.pdf
Florian and I recently conducted workshops for the press and industry pundits on how to use this tool effectively at Samsung’s event facility in New York City. I have also been using the disc to good effect in my field calibrations for clients who have a UHD Blu-ray player and HDR capable display.
Finally, it is important to understand that one cannot simply use one of the current UHD signal generators with HDR Meta Data in them for evaluation and optimization of HDR displays as the test patterns are still all SDR and static. Until we have similar test material in these boxes, the Samsung Reference HDR10 Blu-ray test disc is the best and only tool available now to effectively evaluate, and optimize HDR displays.


